The licauth table contains all agencies that issue occupational licenses. It is furnished to the ARC by state LMI offices. For more detail on this process, see our FAQ.
Data Sources
The source for this data varies by state.
Table Format
In version 2.8 the authority name fields were changed from name1, name2, and name3 to department, division, and board to improve consistency between states.
The license table is furnished to the ARC by state LMI offices. For more detail on this process, see our FAQ.
A review of the data quality and contents was conducted in 2018-2019. A summary of that work is available here.
Data Sources
The original source for this data varies by state. Once it’s been submitted to the ARC it’s reviewed and standardized and made available to the public. The primary means of publication is through the CareerOneStop LicenseFinder tool, but download files are also available from their site and on a state-by-state basis from the ARC. While these are useful for states to review and are helpful for cross-state comparisons, this is not a source for the deliverable that is to be submitted.
There are a number of organizations that have made efforts to track occupational licenses. They rarely are related back to SOC or ONET occupational coding, they may be limited in scope to certain types of occupations, and they may not be frequently updated. However, many add value that the WID structure doesn’t have, such as richer descriptive content or detail on types of requirements (“good moral character”, for example).
Varies
Every state manages this differently and some are handled at the department level rather than by a central source.
This comes from state-submitted data. Improvements made centrally include – standardizing occupational coding so it compares across states, – adding licenses identified as missing by other sources or collected centrally, – adding license compacts, – adding industry where relevant, – organizing descriptions into indicator values for key requirements
Table Format
In version 2.8 several requirements fields were added to allow comparison of license characteristics between states. Preliminary values have been generated from existing license descriptions and other data sources for most licenses.
These codes are generally specific to the WID, not drawn from the data source.
Many states have analysis regions, congressional districts, and WSAs that are available from state sources that can be assigned codes between 50 and 70 at the state’s discretion.
A table containing identifiers for substate geographic areas. For each larger stfips, areatype, area combination, this table will contain a list of unique substfips, subareatyp and subarea smaller combinations that comprise the larger geographic area.
Workforce Development Boards (WDB) are state program areas. They’re defined locally but tracked by CareerOneStop and reviewed annually to ensure they remain current. This data set makes COS verified WDB definitions available in standard GEOG/SUBGEOG format.
MSA
The Office of Management and Budget (OMB) defines Metropolitan and Micropolitan Statistical Areas and the Census Bureau publishes the bulletins as delineation files.
Note: July 2023 continues to use 31 and 32 for areatypes because of the upcoming change to WID 3.0 and the implementation of AreaTypeVersion to distinguish between vintages of areas instead of the previous practice of adding new codes.
Current MSA. Component areas can be found through the Census Bureau or on the subgeog page.
Note: July 2023 continues to use 31 and 32 for areatypes because of the upcoming change to WID 3.0 and the implementation of AreaTypeVersion to distinguish between vintages of areas instead of the previous practice of adding new codes.
Table Format
In version 2.7 the fields LATITUDE (numeric(11,6)), LONGITUDE (numeric(11,6)), GEOPCODE (char(1)) were added
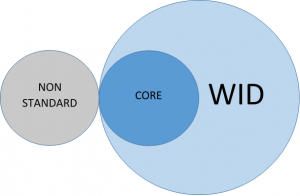
The WID is a database structure to facilitate communication and data sharing between states. It takes common data products and puts them in a format that 1) saves states the work of coming up with their own and creating the documentation to support and maintain it and 2) allows them to use common terms or formats in communications with other states. For these reasons, maintaining data in the prescribed WID format is funded by an ETA grant. However, there can sometimes be confusion about what parts of the WID are required deliverables.
The WID structure document is 146 pages long and includes structure and value information for more than 200 tables, not all of which have available data in every state or jurisdiction.
Required “core” tables – these are largely those tables for which state LMI offices already have BLS data and are summarized in Appendix C. Only core tables are mandated by the ETA grant.
Non-core tables are included for several possible reasons:
They’re likely to be needed by states, or are used by a significant percentage of states. This includes lookup tables of occupation and industry codes, crosswalks between different coding systems.
The data is readily available and provided in WID format by the ARC – population, demographics, and income, for example. These are subjects that are of interest to many state LMI offices and having them in a consistent format has the potential to reduce state workload.
They’re emerging as an area of interest or are core products of a few states. This might include the programs table (which houses IPEDS data, emerging as an area of interest because of WIOA requirements) or the JVS table, which houses job vacancy data some states collect.
Non-standard tables: ARC documentation and files exists for tables that aren’t in the formal WID structure document but are structured such that they could work seamlessly with it, using the same geographic and time references and relating back to the same lookup tables. These include geogxzip and some tax and GDP files. Some WID non-core tables started as non-standard tables, were found to be useful, and made it into the structure document later on.
As stated in the Employment and Training Administration (ETA), Workforce Information Core Products and Services Grant, “States are required to implement and maintain the most current version of the Workforce Information Database and populate all tables designated as core tables in accordance with guidelines issued by the Analyst Resource Center (ARC). Database content must be updated timely in order to be as current as the state’s most recent publications and data releases.”
See the ETA Guidelines page for more information regarding ETA requirements.
The following tables have been designated as the core Workforce Information Database tables. Additional information is available for those tables with links.
This list was last updated 11/21/2019. Changes were made to the lookup tables list to bring it in line with the foreign keys of the data tables and the WID28 documentation.
Income data by geography. Includes income estimates from the Census Bureau and the Bureau of Economic Analysis (BEA).
Data Sources
National
State/Local
Notes
Source
BEA
BEA
BEA income data is available for the US, States, and Counties and is published at various times throughout the year. National data lags by a year, but state and local data are published later.
Census
Census
Census income is available for the US, States, Metro/Micro areas and Counties and is published annually.
This comes from publicly available BEA data and will be available shortly after the official publication date/time. National data is contained in state-specific file.
This is a python script to extract the data from the BEA API and format it to load into the WID. The script contains parameters to define years and areas for extraction allowing users to pull the most current data as needed. It will require a user to obtain a BEA API key and insert it at the line “api_key = ” # insert API key here”
QCEW data is published quarterly with a lag of 6 to 9 months. It is available nationally, statewide, and for counties. States may have different regulations regarding QCEW publication and more detail may be available directly from states.
EXPO
These are for editing and controlled access by LMI Analysts. State-level data is available for download as completed.
This comes from publicly available BLS data and will be available shortly after the official publication date/time. This extract is for the entire year, after the annual publication.
Links to the table description in the current structure document. Note: Page anchors do not work in Microsoft Edge (the default browser for some states).
This table contains the employer data from the Workforce Information Database Employer Database. Contents are furnished by a private contractor and use of the data in the Employer Database is subject to the terms and agreements the found in the contract signed by the states and the Employer Database supplier.
Data Sources
National
State/Local
Notes
Source
vendor
Data is released at the state level from the vendor once or twice a year. It can be arranged to download it from the vendor and a disk is sent to state LMI offices.
CareerOneStop receives the data through the same contract as states. They have produced a search tool and embeddable widget that meets contract requirements that states can link to or insert on their own websites.
WID Version?
N/A
N/A
The download from the vendor is similar to EMPDB structure.
Table Format
There were some values in the most recent release that violated foreign keys. The vendor put out this to explain the difference.
Links to the table description in the current structure document. Note: Page anchors do not work in Microsoft Edge (the default browser for some states).